Profiling in Erlang
The list of available instruments:
- fprof, eprof, cover, cprof (shipped with erlang)
top-like utilities: third party entop и etop- eep
- recon
- eflame and eflame2
- eper
timer:tc/3,statistics/1- latency_histogram_tracer.erl (requires
folsom_metrics)
Note: here are not given the tools, which are used rarely (percept), or on the basis of which more powerful things are built (ttb).
Introduction
An overview of all the tools would be very time-consuming. And I doubt that normal Erlang programmer may need all of them anyway.
Far more important is to know four or five, and based on the results, obtained during profiling, be able to find bottlenecks and decide, whenever they should be fixed or not.
fprof, cprof
Like it or not, you need to know one or two standard tools.
The best place to start: http://erlang.org/doc/efficiency_guide/profiling.html
fprof’s output can be converted into the format suitable for kcachegrind (see below) using the erlgrind.
1> fprof:start().
2> fprof:trace([start, {procs, all}]). % trace all the processes (significantly slows down the system)
3> fprof:trace([stop]).
4> fprof:profile().
5> fprof:analyse([totals, {dest, "fprof.analysis"}]).
6> fprof:stop().
You can find explanations for each command above in the standard docs and also here.
1> cprof:start().
2> cprof:pause().
3> cprof:analyse().
4> cprof:analyse(cprof). % analysing calls of a specific module
5> cprof:stop().
eep
The sequence of steps is quite simple and described in the project’s README.
We start the tracing:
1> eep:start_file_tracing("appname"), timer:sleep(10000), eep:stop_tracing().
Then copy the resulting file: appname.trace to our machine (before that we
gzip it because of it’s size). On our machine, we transform it into the text
format, suitable for
kcachegrind.
1> eep:convert_tracing("appname").
If you still do not have kcachegrind, go install it:
In Ubuntu:
$ sudo apt-get install kcachegrind
After the conversion has finished, we may begin analyzing the results.
$ kcachegrind callgrind.out.appname
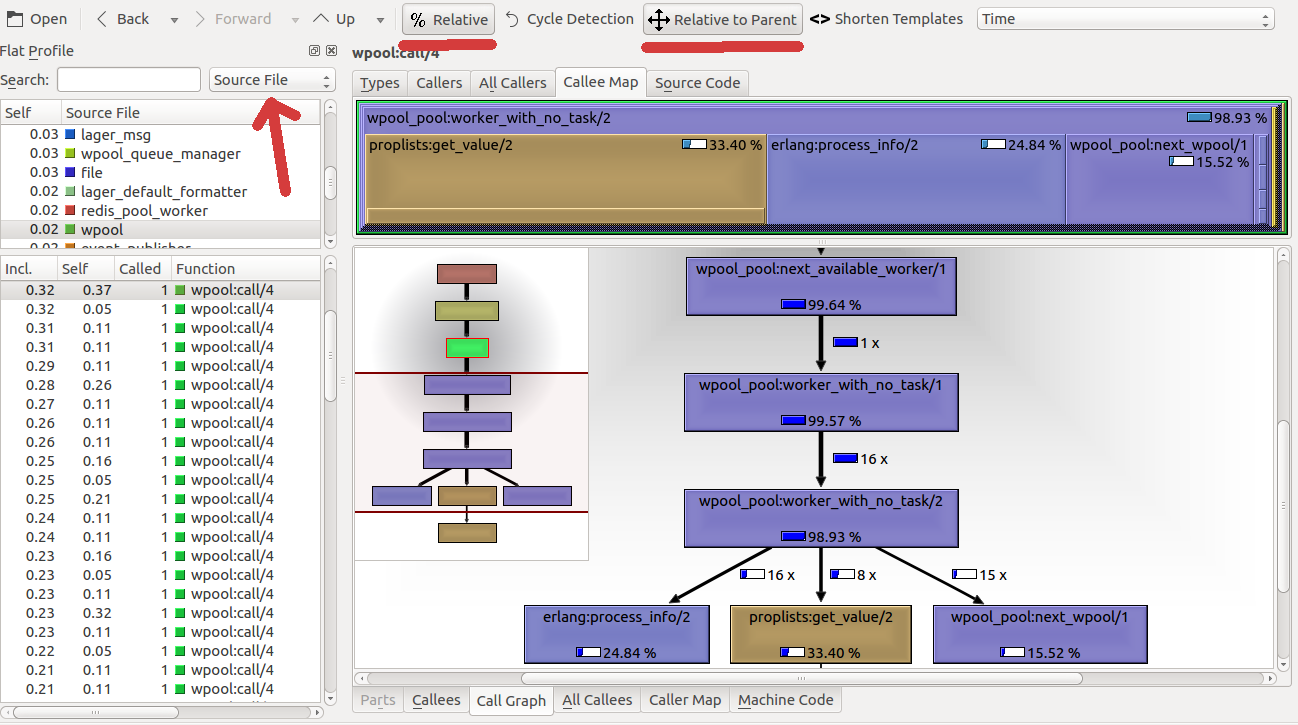
3 important points:
- group by “Source File” (or by “ELF Object” if you target is a particular PID);
- percentage (“Relative”) is better than absolute time;
- percentage relative to its parent (“Relative to Parent”) is even better, otherwise, you can’t understand the damn thing.
“No Grouping” and “Function Cycle” do not give a clear picture of what is
happening. The first option leads to the top lines: gen_server:decode_msg, gen_server:loop, and only indicates that more time spent in gen_server:* -
thank you, captain! I didn’t understand the results of the second option.
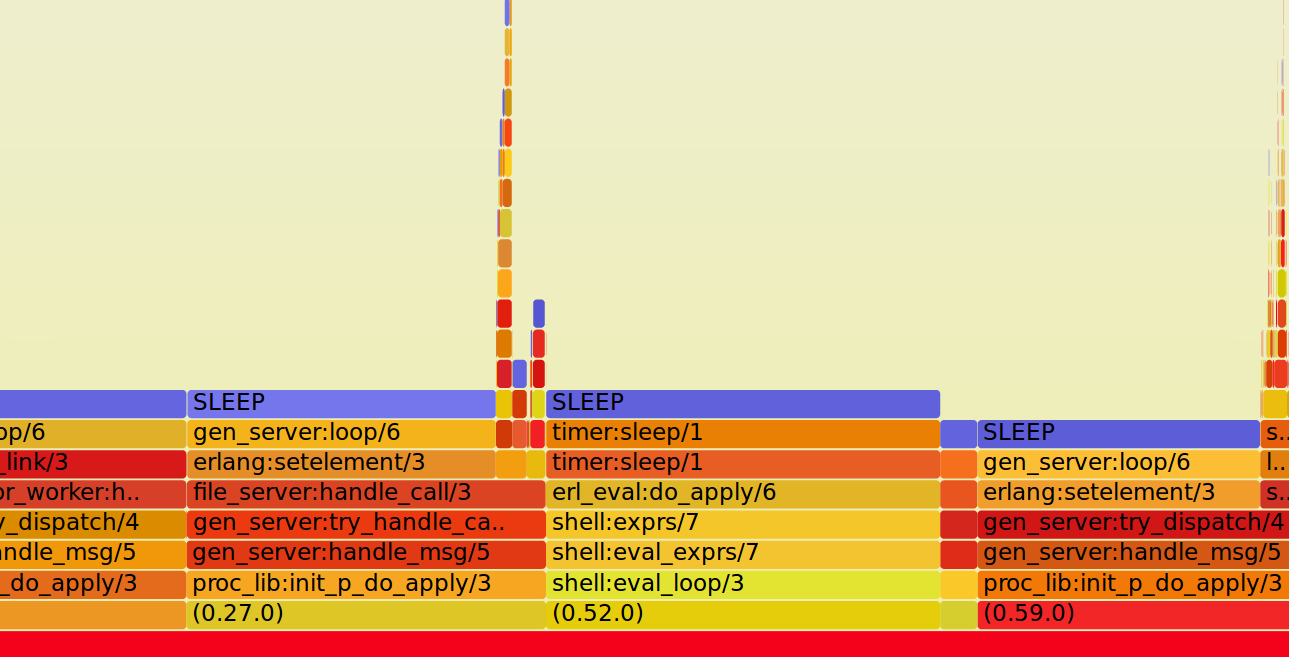
eflame2
1> eflame2:write_trace(global_calls_plus_new_procs, "/tmp/ef.test.0", all, 10*1000).
2> eflame2:format_trace("/tmp/ef.test.0", "/tmp/ef.test.0.out").
According to the docs, we need to run tracing in a separate process. But when I’d tried to do so, I got “Segmentation fault”.
$ cat /tmp/ef.test.0.out | ./flamegraph.riak-color.pl > output.svg
timer:tc
What is there to talk? Recently, I came across an unexpected behavior. Take a look at the following code:
{Time, Result} = timer:tc(fun() ->
    {Time1, Result1} = timer_tc(fun() -> do_smth1() end)
    {Time2, Result2} = timer_tc(fun() -> do_smth2() end)
end)
Time should be equal to Time1 + Time2, right?
Well, not in reality. Time is often greater than Time1 + Time2 (even if I
measure it, say 100 times). I think it is because timer:tc uses os:timestamp and Time includes some switching (when scheduler runs other
process).
Useful links: